
To Our Shareholders and InvestorsOperating Results and Financial Information
Operating Results and Financial Information Consolidated Operating Results
Net sales
(Million yen)

Operating income
(Million yen)

Ordinary income
(Million yen)

Profit attributable to owners of parent
(Million yen)

Net income per share
(yen)

Rate of return on equity
(%)

Return On Invested Capital
(%)
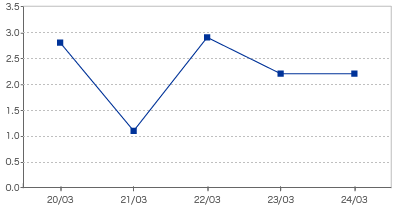
| 2022/03 | 2023/03 | 2024/03 | 2025/03 | 2026/03 | |
| Return On Invested Capital | 2.9 | 2.2 | 2.2 | 5.0 | 3.7 |
Ordinary income to total assets ratio
(%)

Operating income to net sales ratio
(%)
